Beat the Street
Back in 2018 the city of Gloucester (UK) launched an initiative called Beat the Street to motivate people to get out and exercise. Beat Boxes (small rectangular boxes with an RFID chip) were installed at various locations around the city. People were then given a tag (also with an RFID chip) and encouraged to “tap” as many Beat Boxes as they could.
Right after it launched I was excited to collect as many boxes as I could but I quickly realized that this would involve a lot of walking/biking. There were about 70 boxes scattered around the city and some were just too far away. Now if that sounds like a lazy person then you are correct. However being a lazy person with some programming and maths knowledge I thought why not find the shortest path between all Beat Boxes.
Beat the Streat (nay Street)
We start our journey by finding the location of all Beat Boxes. Kudos to the organisation behind Beat the Street who made this task really easy. Not only do they publish a printed map with all locations but this map is also available online. From the Google Maps interface you can download a KML file with the longitude and latitude of all the points and more!
The initiative was launched again in 2019 so I’ll be looking at the 2019 data. I’ll be using François Briatte’s tidykml package to read in the KML file and ggmap to plot them.
library(tidykml)
library(ggmap)
points = kml_points("BTS Gloucester 2019- Most updated.kml")
p <- get_map(location=c(lon=-2.235, lat=51.85), zoom=13, source="stamen")
ggmap(p) +
  geom_point(aes(x=longitude, y=latitude, color=folder), data=points)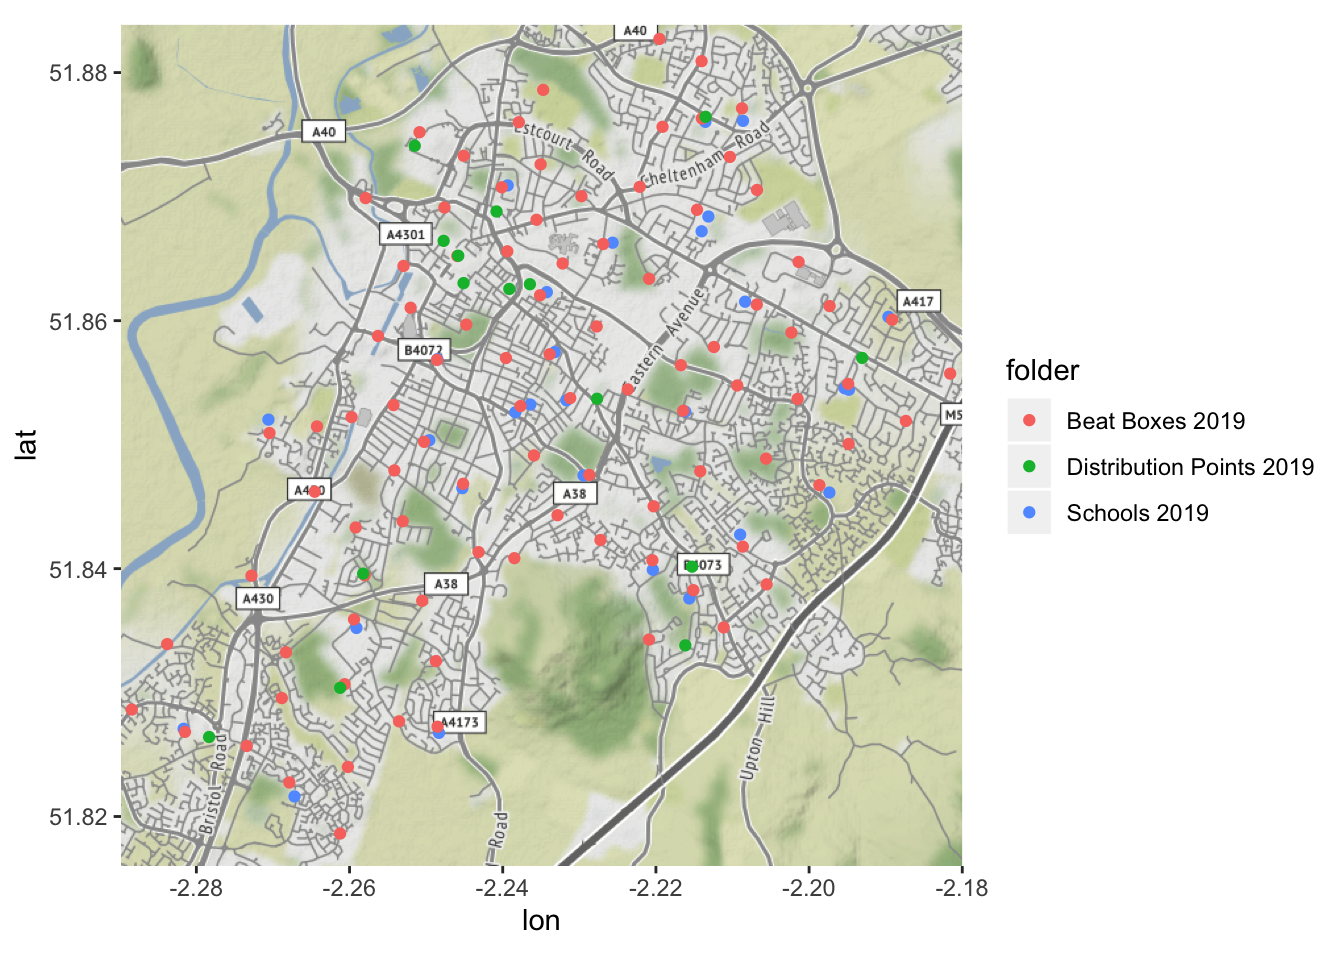
Beat the Street was mainly aimed at school children (and by extension their parents) hence the inclusion of schools on the map. Of course I’m only interested in Beat Boxes so I’ll have to select those specifically. Each record in the points dataset has a name, description, longitude and latitude. Conveniently, only the Beat Boxes have a value for the description.
library(dplyr)
beatboxes <- filter(points, !is.na(description)) %>%
  select(name, latitude, longitude)
head(beatboxes)
## # A tibble: 6 x 3
## name latitude longitude
## <chr> <dbl> <dbl>
## 1 Beat Box 1 51.9 -2.21
## 2 Beat Box 2 51.9 -2.21
## 3 Beat Box 3 51.9 -2.21
## 4 Beat Box 4 51.9 -2.22
## 5 Beat Box 5 51.9 -2.21
## 6 Beat Box 6 51.9 -2.21A stone’s throw away
To calculate the shortest path through all the Beat Boxes we must first know the distance between each Beat Box. You could just take the straight line distance but that would only work if you could walk through walls. Us mere mortals have to use pathways laid out for us which make the actual distance slightly longer.
To get the actual walking distance between two Beat Boxes I’ll use the gmapsdistance package by Rodrigo Azuero. The package provides an user-friendly interface to the Google Maps Distance API (make sure to enable this through the Google Cloud Console). Below is an example of how it works with just two points.
# gmapsdistance expects latitude and longitude as one value
beatboxes <- beatboxes %>%
  mutate(latlong = paste(latitude, longitude, sep="+"))

gmapsdistance(origin = beatboxes[1, "latlong"],
              destination = beatboxes[80, "latlong"],
              mode = "walking")
## $Time
## [1] 1481
##
## $Distance
## [1] 1946
##
## $Status
## [1] "OK"Querying an API is always tricky, especially one where you might have to pay for the number of queries. If I was to get the distance between each Beat Box I’d have to query the API 8556 number of times ((#beatboxes x #beatboxes) - #beatboxes). Although the question is if we want all these distances. And the answer is no because I’m a lazy git and most likely to walk to the nearest Beat Box if that option is there. So we can limit the number of options from one Beat Box to the ones that are nearest (say within 1 km).
However to actually perform the limiting we must first know the distance, it’s the chicken and egg all over again. The workaround is to approximate the distance with another metric. Let’s try the well known Haversine formula for the great circle distance.
# The following Haversine formula for the great circle distance is taken from
# https://www.r-bloggers.com/great-circle-distance-calculations-in-r/

deg2rad <- function(deg) return(deg*pi/180)

great_circle_distance <- function(long1, lat1, long2, lat2) {
  long1 <- deg2rad(long1)
  lat1 <- deg2rad(lat1)
  long2 <- deg2rad(long2)
  lat2 <- deg2rad(lat2)
  R <- 6371 # Earth mean radius [km]
  delta_long <- (long2 - long1)
  delta_lat <- (lat2 - lat1)
  a <- sin(delta_lat/2)^2 + cos(lat1) * cos(lat2) * sin(delta_long/2)^2
  c <- 2 * asin(min(1,sqrt(a)))
  d = R * c
  return(d) # Distance in km
}
# create a join of all the beatboxes with each other
beatboxes['dummy'] <- 1

bb_with_distance <- full_join(beatboxes, beatboxes, by=c('dummy')) %>%
  filter(name.x != name.y) %>%
  select(-dummy) %>%
  mutate(gcd = great_circle_distance(longitude.x, latitude.x,
                                     longitude.y, latitude.y))
Calculating that was easy but what does it actually look like?
summary(bb_with_distance$gcd)## Min. 1st Qu. Median Mean 3rd Qu. Max.
## 0.3217 0.3217 0.3217 0.3217 0.3217 0.3217Well, that doesn’t really seem right. Turns out the Haversine formula doesn’t really work for short distances. So we move on to the next best thing which is a simple Euclidean distance. Simple if you still remember your trigonometry that is. And yes, I realize this is just the straight line distance I dismissed earlier but what can you do.
# The following is taken from
# https://conservationecology.wordpress.com/2013/06/30/distance-between-two-points-in-r/
euclidean_dist <- function (long1, lat1, long2, lat2){
  long1 <- deg2rad(long1)
  lat1 <- deg2rad(lat1)
  long2 <- deg2rad(long2)
  lat2 <- deg2rad(lat2)
  delta_lon <- long2 - long1
  delta_lat <- lat2 - lat1
  a <- (sin(delta_lat/2))^2 + cos(lat1) * cos(lat2) * (sin(delta_lon/2))^2
  c <- 2 * atan2(sqrt(a), sqrt(1 - a))
  R <- 6371
  d <- R * c
  return(d)
}

bb_with_distance <- mutate(bb_with_distance,
                           euclid = euclidean_dist(longitude.x, latitude.x,
                                                   longitude.y, latitude.y))
It’s always good to do a quick sanity check of your code. Here we’ll check how good the Euclidean distance approximates the actual walking distance.
beatbox_start = 'Beat Box 62'
beatbox_end = 'Beat Box 64'

bb_with_distance %>%
  filter(name.x==beatbox_start, name.y==beatbox_end) %>%
  mutate(latlong.x = paste(latitude.x, longitude.x, sep="+"),
         latlong.y = paste(latitude.y, longitude.y, sep="+"),
         # gmapsdistance returns a list so we pluck the value we want
         actual_distance = pluck(gmapsdistance(origin=latlong.x,
                                               destination=latlong.y,
                                               mode="walking"),
                                 "Distance"),
         euclid = euclid*1000) %>%
  select(name.x, name.y, euclid, actual_distance)
## # A tibble: 1 x 4
## name.x name.y euclid actual_distance
## <chr> <chr> <dbl> <dbl>
## 1 Beat Box 62 Beat Box 64 533. 578That’s a good enough approximation for our initial filter. Now we can have a look at what the impact is of limiting the number of Beat Boxes.
Below is a graph of the distribution of the 10 nearest Beat Boxes around each Beat Box.
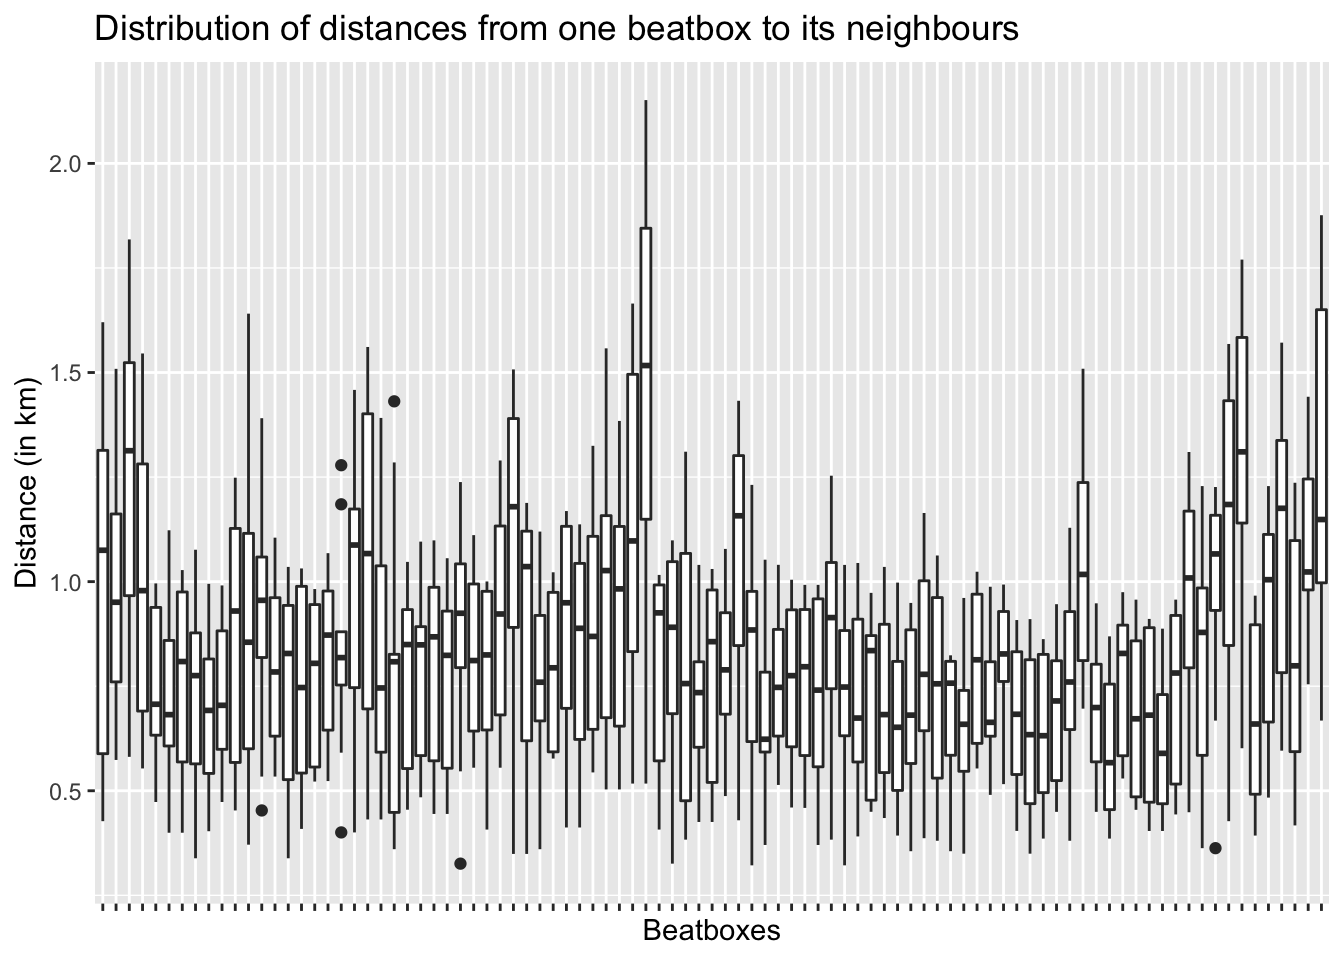
We see that most Beat Boxes are near to each other but there are a few outliers. For these outliers, limiting to the Beat Boxes within a certain distance might not leave many options. So it’s important we choose our limiting distance wisely.
Let’s have a look at how many options each Beat Box would have if we were to apply the limiting distance. Below is a graph of the distribution of the options for a Beat Box for a set number of limiting distances.
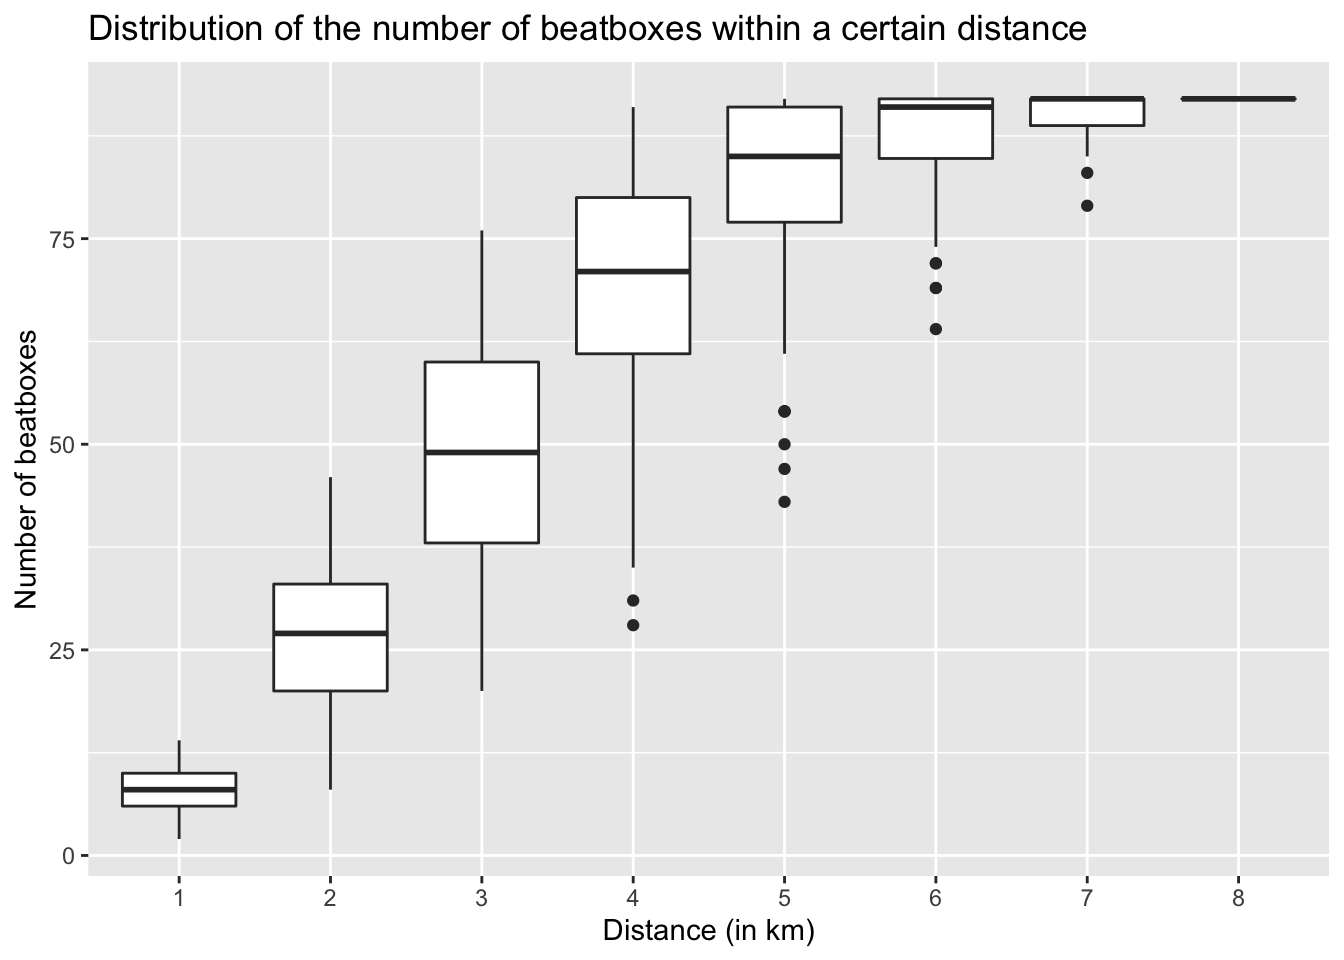
It’s obvious that the options are at their highest when the limiting distance is large (about 80 options within an 8 km radius). But even when the distance is at its lowest, there is still a reasonable amount of options. So I’m going to limit the number of options for each Beat Box to the Beat Boxes within 1 km.
The thing we wanted all along…
With that out of the way I can finally unleash the power of Google’s mighty distance calculating algorithms and retrieve the actual distances.
my_distance <- function(origin, destination){
  result = gmapsdistance(origin, destination, combinations='pairwise',
                         mode='walking')
  return(result$Distance$Distance)
}

selected_beatboxes <- bb_with_distance %>%
  filter(euclid < 1) %>%
  mutate(latlong_x = paste(latitude.x, longitude.x, sep="+"),
         latlong_y = paste(latitude.y, longitude.y, sep="+"),
         actual_distance = my_distance(latlong_x, latlong_y)) %>%
  select(name.x, name.y, latitude.x, longitude.x, latitude.y, longitude.y,
         actual_distance)
Again, performing a sanity check on the results is recommended. I wonder which Beat Box combination has the shortest distance:
closest_bb <- selected_beatboxes[which.min(selected_beatboxes$actual_distance),]
closest_bb %>% select(name.x, name.y, actual_distance)
## # A tibble: 1 x 3
## name.x name.y actual_distance
## <chr> <chr> <dbl>
## 1 Beat Box 74 Beat Box 79 466That of course doesn’t say much as I have no idea where those two Beat Boxes are. There’s a really cool function in ggmap which allows you to draw the actual route between two points (using geom_path).
route <- ggmap::trek(c(closest_bb$longitude.x, closest_bb$latitude.x),
                     c(closest_bb$longitude.y, closest_bb$latitude.y),
                     mode='walking')

get_map(location=c(lon=-2.235, lat=51.865), zoom=16, source="stamen") %>%
    ggmap() +
    geom_path(aes(x=lon, y=lat), data=route, size=2, color="red")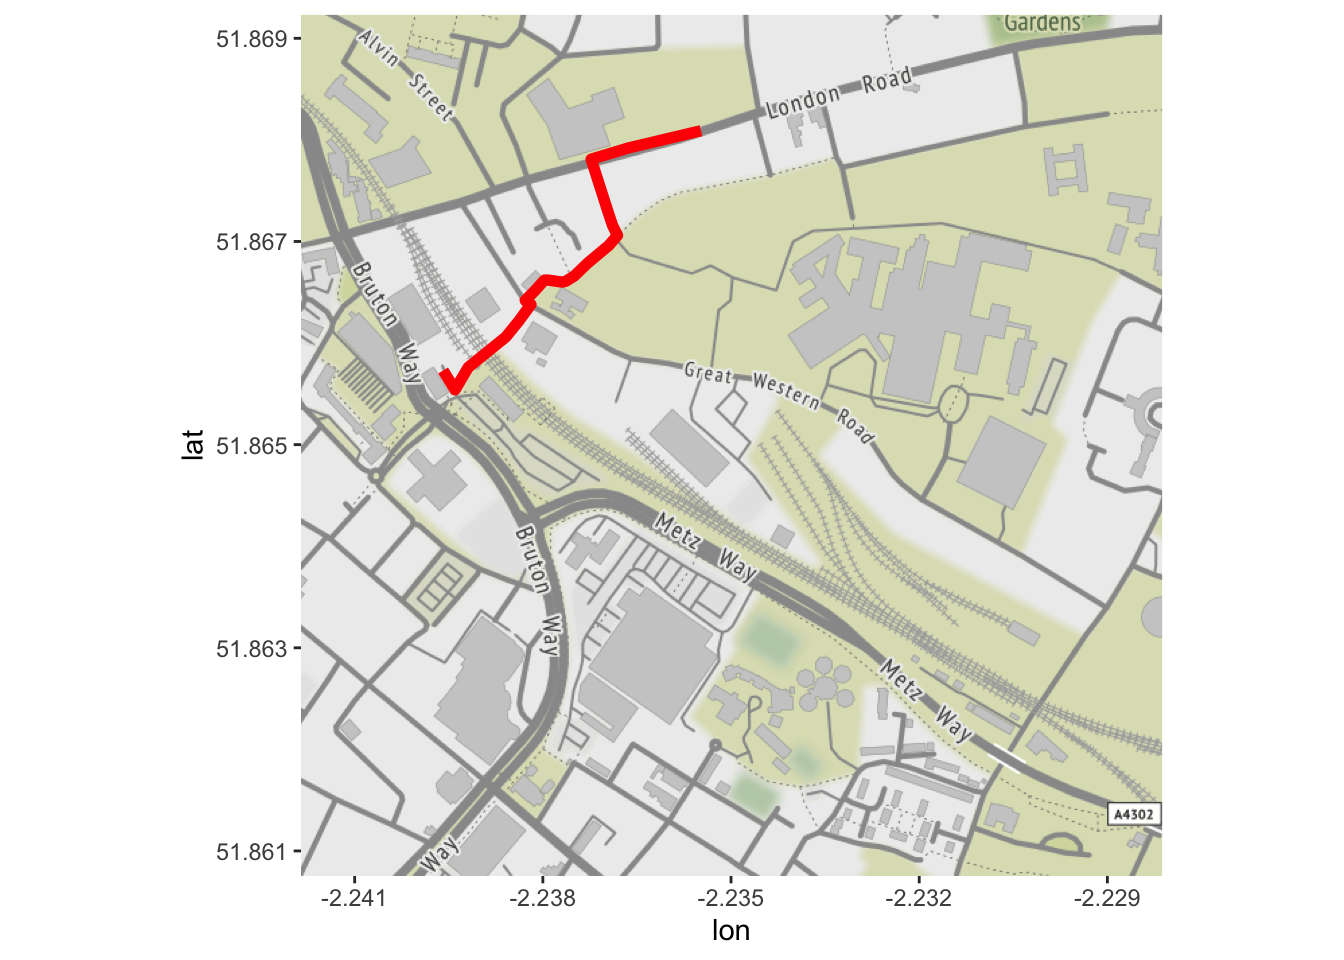
Hang on a minute, it looks like that route goes across the rail track or through the station. Silly Google, there’s no public pathway through the station. Or is there? Well, some further investigation revealed there is actually a pedestrian tunnel that goes underneath the track at Gloucester Station:

Gloucester Pedestrian Underpass
I guess one of the objectives of Beat the Street is to get residents to learn about their city so I would say mission accomplished!
At the roundabout, take the sixth exit
Now comes the hard part, how to find the optimal route between all these points? This is a common problem in many industries, from routing trucks to routing delivery drivers. The folks at InstaCart did a write-up about it with more details.
I won’t go into all the different ways you can solve this here. Instead I’ll do what the average data scientist usually does: look for the solution online and copy/paste. In this case, the solution provided by Randy Olsen (the US city trip one) fits perfectly. The solution uses a genetic algorithm and is in Python but that’s where reticulate comes in.
library(reticulate)

source_python("optimal_road_trip.py")

bb_with_distance %>%
  left_join(selected_beatboxes) %>%
  select(waypoint1 = name.x, waypoint2 = name.y, distance_m = actual_distance) %>%
  tidyr::replace_na(list("distance_m"=10000)) %>%
  find_optimal_route(. , generations=10000L) -> result
You may have noticed I didn’t simply pass selected_beatboxes to the algorithm but joined it to all the Beat Box combinations first. By giving the algorithm more options to choose from, the possibility of a solution increases. The distance for the less desirable options (those Beat Boxes that are far away) is set to a large value, thus penalizing the algorithm if it chooses them.
As usual, sorting out the data took a lot more time than figuring out the solution. But what is the solution? The result from the algorithm is just a list of Beat Boxes:
head(result, 3)## [[1]]
## [1] "Beat Box 74"
##
## [[2]]
## [1] "Beat Box 75"
##
## [[3]]
## [1] "Beat Box 67"Let’s convert it to a data frame and add in the longitude, latitude and distance information.
result %>%
  map_chr(pluck, 1) %>% # convert the list to a vector
  tibble(name.x=.) %>% # convert the vector to a tibble
  mutate(name.y = lead(name.x, 1)) -> my_route

# connect the end to the beginning
my_route[nrow(my_route), "name.y"] <- my_route[1, "name.x"]

my_route %>%
  # add in the actual distance
  left_join(selected_beatboxes) %>%
  select(name.x, name.y, actual_distance) %>%
  # for the less desirable options add in the approximated distance
  left_join(bb_with_distance) %>%
  mutate(actual_distance = ifelse(is.na(actual_distance),
                                  euclid*1000, actual_distance)) %>%
  # some fancy renaming
  select(from=name.x, to=name.y, latitude_from=latitude.x,
         longitude_from=longitude.x, latitude_to=latitude.y,
         longitude_to=longitude.y, actual_distance) -> my_route
The real question is how long is this “optimal” route?
sum(my_route$actual_distance)## [1] 80862.16What!?! In a previous iteration I made a slight miscalculation (read: mistake) and the total distance was around 10km. Seeing the optimal distance be this high is shocking, I’m definitely not going to be walking that any time soon. But if I were to walk it (with an average walking speed of 5 km/h) it would only take 16.2 hours.
Moving on, the most interesting part is of course the actual route so let’s have a look:
get_route <- function(row){
  route <- ggmap::trek(c(row$longitude_from, row$latitude_from),
                       c(row$longitude_to, row$latitude_to), mode='walking')
  return(route)
}
full_route <- purrrlyr::by_row(my_route, get_route, .labels = FALSE, .collate = "rows") 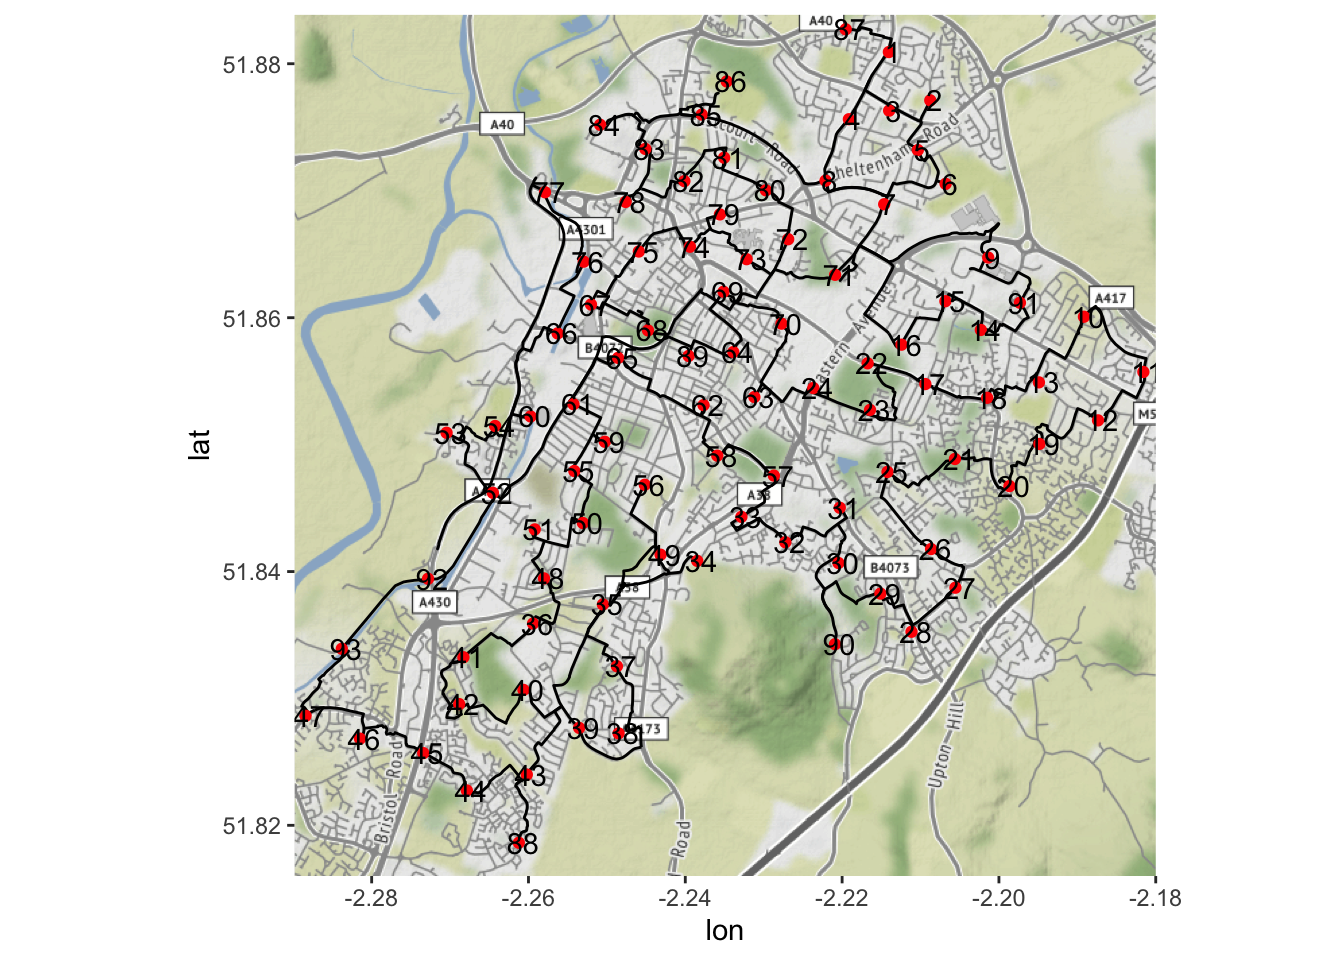
That…looks complicated. There are some instances where you have to backtrack on yourself (schools in a cul-de-sac I assume) and some instances where sections of the route overlap. At points where the route intersects with itself it’s also not clear which direction to go in. See here for a larger version. It will probably be helpful to add the order of the Beat Boxes and somehow include that into the plot.
Note that this is the map for walking the route, the map for cycling will look slightly different. If you’re really lazy than you could do the route by car but that’s just cheating.
Once again, I take my hat off to the organizers behind Beat the Street. I can only imagine how much work is involved in finding Beat Box locations, installing them and ensuring they work properly.
It’s something to contemplate whilst walking 81 km I suppose.