A random rstats year overview
It’s been a year or so since I stopped actively following the rstats community or R development in general. I checked in here and there but I didn’t need to use R on a daily basis so I let it slip. However recently I felt the need to pick it up again and what better way than to write a blogpost about it.
How do you keep up with a programming language and its community? Methodically.
The Source
Let’s start at the source. There have been 5 releases between July 2019 and July 2020:
| Version | Date | Name |
|---|---|---|
| 3.6.2 | 2019-12-12 | Dark and Stormy Night |
| 3.6.3 | 2020-02-29 | Holding the Windsock |
| 4.0.0 | 2020-04-24 | Arbor Day |
| 4.0.1 | 2020-06-06 | See Things Now |
| 4.0.2 | 2020-06-22 | Taking Off Again |
The easiest way to find out what has changed in each version is to check out R News. The minor version updates mainly contain bug fixes and updates to low level code so I’ll skip that. It is the major release that has some “SIGNIFICANT USER-VISIBLE CHANGES”, I like how they put that in capital letters.
The two biggest changes for me are a new raw string syntax and stringsAsFactors being FALSE by default. Yes, you heard it right, the default value for stringsAsFactors has finally changed.

If you want to know why it was set to TRUE in the first place, I highly recommend Roger Peng’s blogpost. As for the raw string syntax, that’ll save a lot of backslashes when working with regex. Here’s a quick example of what you can now do:
r"(C:\Program Files)"## [1] "C:\\Program Files"Check out Luke Tierney’s talk at useR!2020 for more information about these and other changes.
The one thing that really strikes me, as a casual R user at the moment, is that none of the changes in the changelog really affect me. Perhaps my reliance on packages has become so great that I’ll only notice changes to core R when or if package authors decide to pass them through.
The Postman always delivers…packages
So instead of looking at core R maybe I should be looking at changes to packages. At the time of writing there are 16035 packages. Here is me going through 16035 changelogs:

Of course I’m not going to do that! A better idea is to just look at updated and new packages. Joseph Rickert did something similar on the Revolutions blog using data from Dirk Eddelbeutel’s CRANberries website. The website publishes news about any updated and new packages, there’s even an accompanying Twitter account. There are two ways I can get at the data I want: download the tweets or extract the data from the website’s RSS feed. I’ll go for the second option because it’s much richer information and I haven’t done that before.
I’ll be using the feedeR package by Andrew Colliers to tap the RSS feed. The script that underpins CRANberries also outputs results by month of the year so all I have to do is point my code to the correct time periods.
library(feedeR)

get_data <- function(date){
  year <- year(date)
  month <- stringr::str_pad(month(date), 2, pad="0")
  return(feed.extract(glue::glue("http://dirk.eddelbuettel.com/cranberries/{year}/{month}/index.rss")))
}

map(ymd(20190701) + months(0:11), get_data) %>%
  map_df(~pluck(.x, "items")) -> pkg_data

glimpse(pkg_data)
## Rows: 16,407
## Columns: 5
## $ title <chr> "Package SpatialPack updated to version 0.3-8 with prev…
## $ date <dttm> 2019-07-31 17:02:00, 2019-07-31 17:02:00, 2019-07-31 17:…
## $ link <chr> "http://dirk.eddelbuettel.com/cranberries/2019/07/31#Spat…
## $ description <chr> "\n<p>\n<strong>Title</strong>: Tools for Assessment the…
## $ hash <chr> "85f698ba19c8492f", "f4a6dc277a61972b", "a578f1fb1dd7f8de…So what have I missed in the past year? Let’s visualise the number of updated/new packages and see.
pkg_data <- pkg_data %>%
  mutate(type=ifelse(stringr::str_detect(title, 'updated'), 'updated', 'new'),
         date=as_date(date))

table(pkg_data$type)
##
## new updated
## 4634 11773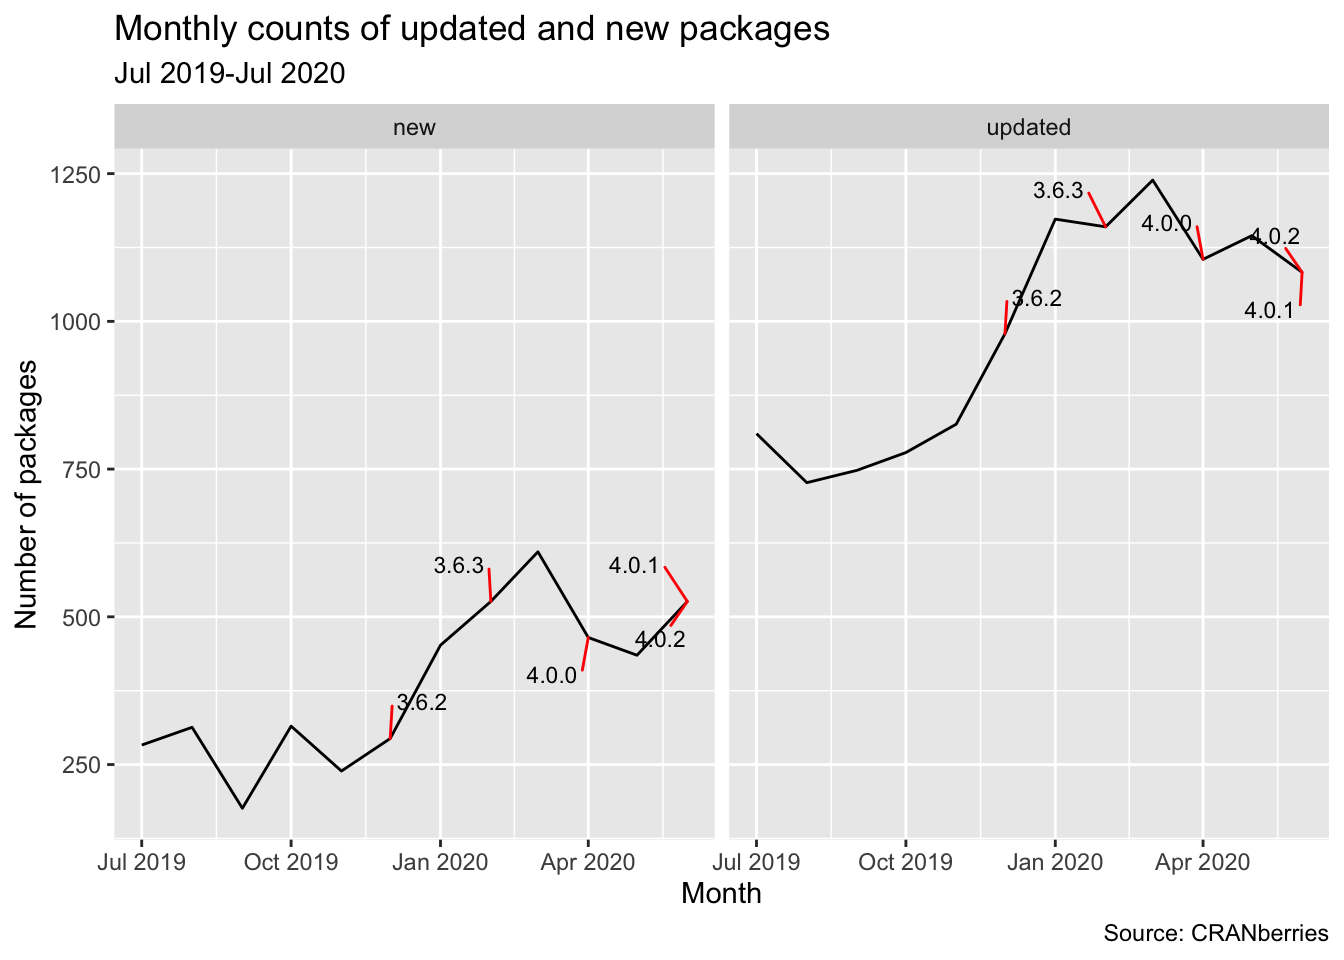
There have been 4634 new packages on CRAN in the past year, that’s amazing! Even on a monthly basis the growth is crazy, the monthly number of new packages almost doubled in the first half of 2020. The pattern is repeated for the monthly number of updated packages. I wonder if it is a seasonal effect or some other external factor. I’ve added the releases of new R versions but it’s hard to say if that is the cause.
Nevertheless, this doesn’t really solve my problem as I don’t really want to go through 4634 packages (never mind the 11K updates). Perhaps I can extract the most interesting ones by looking at number of downloads. The cranlogs package from the nice people at RStudio gives us the number of downloads from the RStudio CRAN Mirror.
the_pkgs <- pkg_data %>%
  mutate(package = stringr::str_match(title, '(?<=[Pp]ackage )\\S*')[1]) %>%
  # regex explained: any non-white space characters after the word package
  select(package, type) %>%
  distinct()

library(cranlogs)

split(the_pkgs$package, ceiling(seq_along(the_pkgs$package)/500)) %>%
  # a split is needed until cranlogs#10 is resolved
  map_df(~cran_downloads(package=.x, from='2019-07-01', to='2020-06-30', total=TRUE)) %>%
  select(package, count) %>%
  distinct() %>%
  left_join(the_pkgs) %>%
  arrange(desc(count)) -> pkg_downloads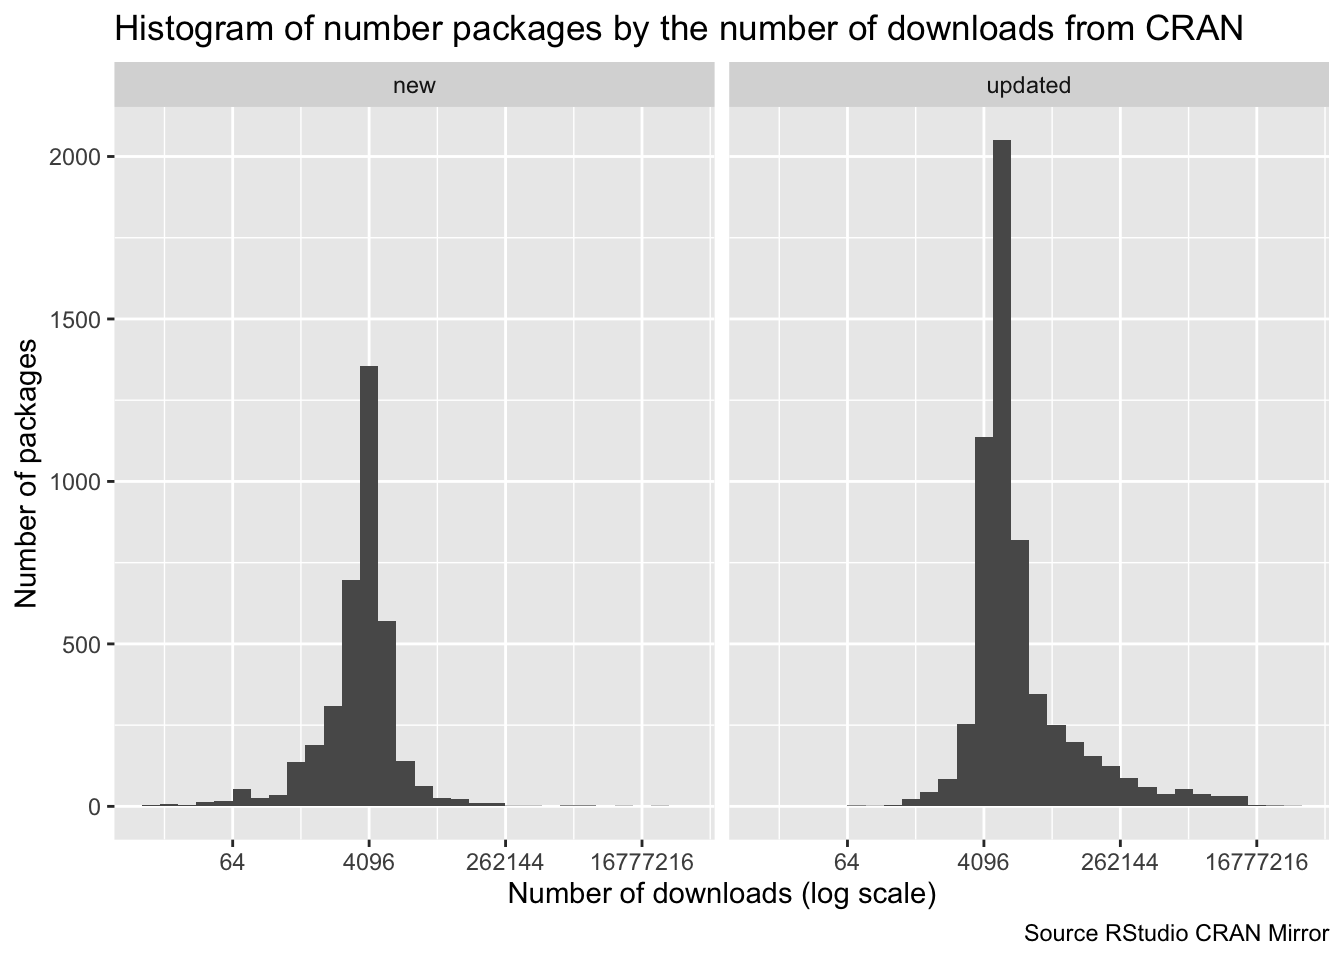
I have my doubts about the log transformation on the x-axis but the conclusion remains the same. There are a number of packages that are downloaded a very large number of times but the majority is only downloaded a handful of times. Using number of downloads as a proxy for ‘interestingness’ I can now narrow the field. Let’s see what the top 10 looks like.
| Top 10 downloaded packages | |||
|---|---|---|---|
| New Packages | Updated Packages | ||
| package | count | package | count |
| aws.s3 | 33247993 | aws.ec2metadata | 38373146 |
| lifecycle | 8641283 | rsconnect | 37618108 |
| fastmap | 3407634 | aws.s3 | 33247993 |
| lme4 | 3114253 | rlang | 17630623 |
| psych | 1664886 | ggplot2 | 13939669 |
| fracdiff | 1579339 | dplyr | 13514400 |
| subselect | 499165 | vctrs | 12852910 |
| leaflet.providers | 367060 | Rcpp | 12411703 |
| parameters | 223878 | ellipsis | 11457747 |
| lsei | 223113 | tibble | 11394919 |
| Source RStudio CRAN Mirror | |||
Obviously the majority of the top packages are going to be from the tidyverse. These are mostly mature packages so I don’t expect many changes in the core functionality, meaning I’ll review the recent updates whenever I use the package. Let’s focus on the new packages instead. Here we see aws.s3 and lme4 which aren’t really new packages, the former has lived on GitHub for a while and the latter is just a port to S4 classes. We also see some packages that were new but already have been archived, such as lsei. Good to see CRAN is being kept clean and tidy. The list of new packages does reveal some packages to explore (e.g. fastmap looks interesting) but overall it is still too long. If only there was someone that had done the job of filtering interesting packages for me…
I am La-Zy, God of dawdle
That someone is Joseph Rickert, now at RStudio, where he posts his top new packages every month. Here’s an example for September 2019, they’re even categorized!
I could stop here and go through the 12 blogposts manually but where would the fun be in that. Instead let’s use rvest to scrape the posts and extract the list of new packages.
library(rvest)

fetch_data <- function(url){
  post <- read_html(url) %>%
    html_nodes(".article-entry") %>%
    html_nodes("h3, p")

  headers <- map_chr(post, ~ ifelse(html_name(.x) == 'h3',
                                    html_text(.x), NA))
  packages <- map_chr(post, ~ ifelse(html_name(.x) == 'p',
                                     (html_nodes(.x, 'a') %>% html_text())[1], NA))

  tibble(Category=headers, Package=packages) %>%
    tidyr::fill(Category) %>%
    tidyr::drop_na() -> result

  return(result)
}

urls <- readLines('top40_rviews_pkgs.txt')
rviews_pkgs <- map_dfr(urls, fetch_data)

head(rviews_pkgs)
## # A tibble: 6 x 2
## Category Package
## <chr> <chr>
## 1 Data eia
## 2 Data litteR
## 3 Data rSymbiota
## 4 Data Science bdpar
## 5 Data Science modeLLtest
## 6 Finance lazytradeIt was easier to get just the packages but I also wanted to get the category, hence the double use of map_chr. Either way, the scraping resulted in 441 packages (because 11 x 40 = 441, right?). Let’s see how the packages are distributed over category.
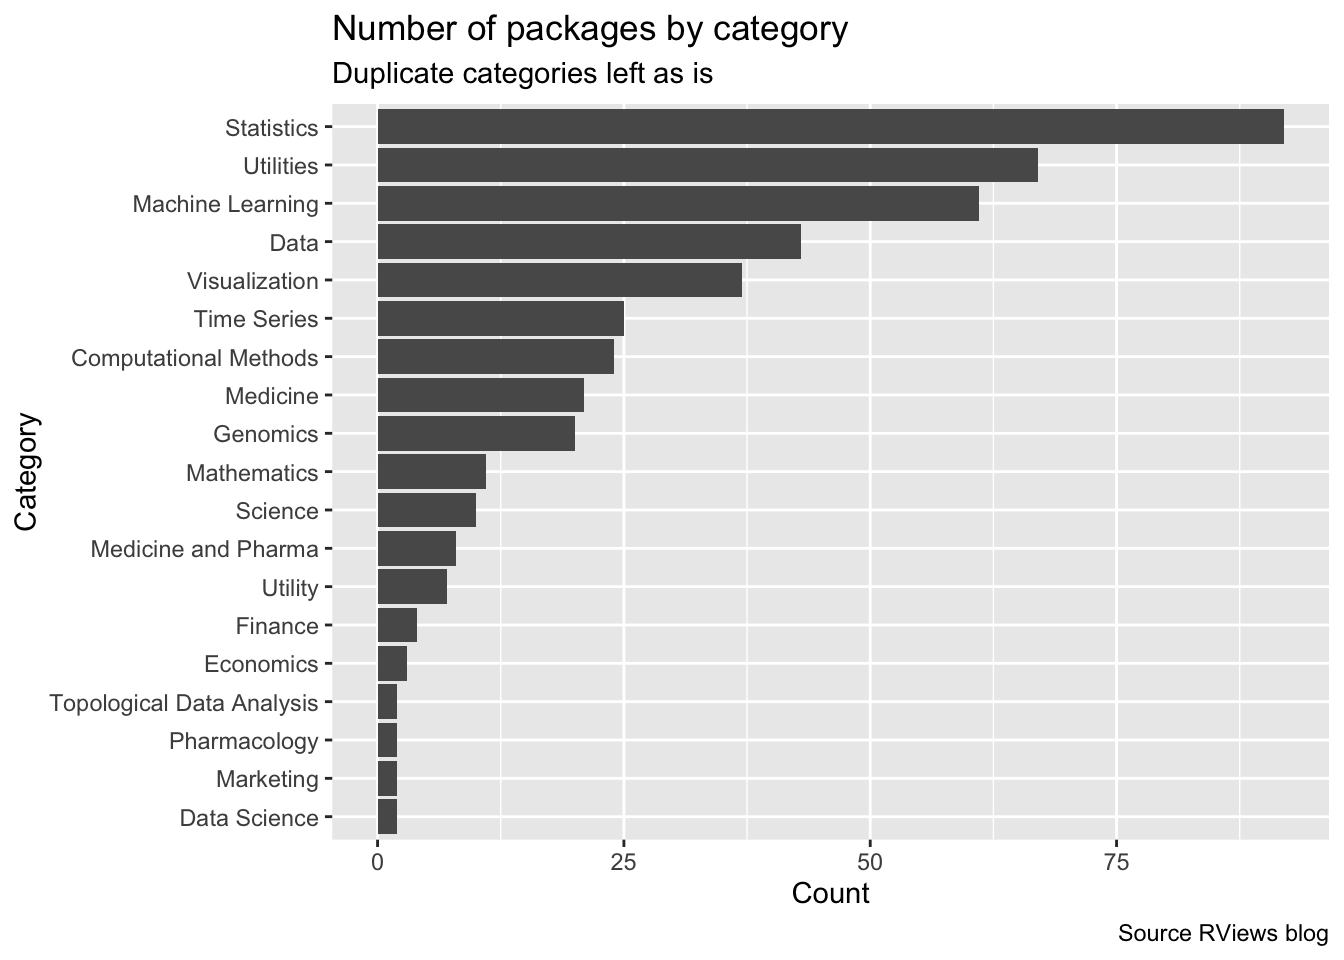
It makes sense Statistics would be the top category so I guess that’s a good sanity check. Category is an interesting property by which I can further filter down. For example, I’m not really interested in packages from the Genomics or Medicine category.
For now I’ll restrict myself to packages from Utilities and Machine Learning which is still 128 packages. Maybe if I join this to the number of downloads I can work my way down.
| Category | Package | count |
|---|---|---|
| Utilities | fastmap | 3407634 |
| Utilities | arrow | 162767 |
| Utilities | renv | 118931 |
| Utilities | warp | 93468 |
| Machine Learning | mlr3 | 49123 |
| Utilities | googlesheets4 | 45286 |
| Utilities | hardhat | 38556 |
| Utilities | gt | 28884 |
| Utilities | pins | 23925 |
| Machine Learning | mlr3pipelines | 22274 |
| Utilities | progressr | 20378 |
| Machine Learning | azuremlsdk | 13704 |
| Machine Learning | quanteda.textmodels | 11196 |
| Machine Learning | mlr3proba | 9840 |
| Utilities | gridtext | 9640 |
| Utilities | babelwhale | 8268 |
| Utilities | modelsummary | 7986 |
| Machine Learning | modelStudio | 7851 |
| Machine Learning | forecastML | 7249 |
| Utilities | butcher | 7020 |
I have already mentioned fastmap but just going through the list amazes me. I mean pins solves my data problems, gt solves my table formatting problems (I’ve been using it throughout this blogpost), renv solves my environment problems, etc., etc.
It looks like the past year has been good and I have missed a lot. So if you don’t mind, I’ll now be going down the rabbithole and try all these goodies out.